Economic Week - December 18
by Nick Clark
It’s been a big week of economic data to finish the year…
This is my last commentary for 2020. Normal service will resume on 15 January but, in the meantime, we will be undertaking our January 2021 Farm Confidence Survey. Federated Farmers members should look out for an email invitation in the New Year.
I wish everyone reading this a very happy Christmas and New Year and all the very best for 2021. May it be a lot better than 2020 has been.
A great rebound but will it last?
The New Zealand economy bounced strongly in the September quarter, according to Statistics NZ’s Gross Domestic Product (GDP).
Not only did GDP jump 14.0% in the September 2020 quarter compared to the preceding June quarter, but there was also an upward revision for the pandemic-ravaged June quarter, with its initial 12.2% crash becoming ‘only’ an 11.0% slump. Although GDP for the full year to September 2020 was down 2.2% compared to the year ended September 2019, September quarter’s GDP was actually 0.4% higher than it was for the same quarter last year.
The biggest quarterly increases in GDP were for construction (up 52.4%); retail trade and accommodation (up 42.8%); and arts, recreation, and other services (up 26.8%) – all sectors hammered by the June quarter lockdown. In contrast, agriculture forestry, and fishing, which (apart from forestry) was not as badly affected during the June quarter, grew a relatively modest 2.9%.
Looking at annual growth (comparing the year to September 2020 to the year to September 2019) most industries suffered declines. Those that grew were industries that would be expected to grow under the circumstances of a pandemic and associated restrictions:
- Public administration and safety (up 5.7%);
- Health care and social assistance (up 2.1%);
- Rental, hiring, and real estate services (up 1.2%);
- Information media and telecommunications (up 1.2%); and
- Financial and insurance services (up 0.8%).
Agriculture, forestry, and fishing GDP declined 4.7% on an annual basis, perhaps a reflection of the severe summer and autumn drought which impacted on farm production in many areas.
No doubt about it, our economy has proven more resilient and has recovered from lockdown much faster than anyone expected earlier in the year. That’s great but it’s already in the past and the big question is whether the momentum will be sustained. Economic data for the about-to-end December quarter has been patchier with suggestions that economic momentum has slowed or even stalled. And casting ahead to 2021 there remain many uncertainties and risks to cloud the horizon.
Current account deficit narrows
New Zealand recorded a current account deficit in the September 2020 quarter but the annual deficit got smaller, according to Statistics NZ’s quarterly Balance of Payment and International Investment Position.
The quarterly current account deficit of $438 million after seasonal adjustment came after a rare surplus in the previous June quarter. The return to deficit was due to a recovery in goods imports (up $1.07 billion) after pandemic-related disruptions in the June quarter, while goods exports dropped by $280 million. In contrast, services exports increased while services imports decreased.
Although there was a return to a quarterly deficit, the current account deficit for the year ended September 2020 shrunk to $2.55 billion (0.8% of GDP). This was down from a $5.68 billion deficit for the year ended June 2020 (1.8% of GDP) and a $11.68 billion deficit for year ended September 2019 (3.7% of GDP). The annual deficit was the smallest in nearly 20 years.
Meanwhile, New Zealand’s international investment position at 30 September 2020 was a net liability position of $177.92 billion (55.5% of GDP), $2.37 billion smaller than at 30 June 2020.
Fiscal outlook improves
The quicker than expected economic recovery is forecast to reduce the size of fiscal deficits and associated debt build up, according to the Treasury’s Half Year Economic and Fiscal Update (HFEYU).
In May the Budget painted a very gloomy picture and three months ago the Pre-Election Economic and Fiscal Update (PREFU) was still forecasting a 0.5% contraction in GDP for the year to June 2021 – better but still not great. However, this forecast has now been upgraded to a 1.5% increase, and will be followed by solid increases of 2.6%, 3.7%, 3.8%, and 3.2% over the following years to 2025. The unemployment rate is forecast to be 6.6% in June 2021, rather lower than PREFU’s forecast of 7.7% (and the Budget’s 8.6%) and will then fall back to the pre-pandemic rate of 4.0% in 2025.
Consumer price inflation is forecast to remain contained between 1.2% and 2.1% over the years to 2025 (mostly unchanged from both the Budget and PREFU), but house prices are expected to keep on rising. They are now forecast to rise 8.5% for the year to June 2021 (whereas PREFU was still expecting them to fall!) and to keep on increasing by between 4.5% and 5.5% per year over subsequent years to 2025.
The better economic outlook is forecast to lead to higher tax revenues ($4 billion more each year compared to PREFU) and overall a little less spending, especially in the current year to June 2021 ($5 billion less than expected). The net result should be a smaller fiscal deficit, with the operating balance excluding gains and losses forecast to be $21.6 billion in the current year to June 2021 (down from a monster $31.7 billion in PREFU). The deficits are then forecast to reduce over the following years to ‘only’ $4.2 billion in 2025.
With smaller deficits the build-up in debt is forecast to be less than earlier forecast. For the current year to June 2021, net core Crown debt will be $128.6 billion (39.7% of GDP), a little less than the PREFU forecast of $130.2 billion (43.0% of GDP). By 2025 net core Crown debt is forecast to be on its way down and will be $190.0 billion (46.9% of GDP).
On the crucial question of where economic and fiscal policy is heading, there’s not a lot to report. Usually, the HYEFU is accompanied by a Budget Policy Statement (BPS), which sets out priorities for the coming year’s budget, but it has been delayed to the New Year.
The HYEFU provides the Government with good news and provides a bit of light at the end of the fiscal tunnel. It’s important to remember though that economic and fiscal forecasts can be fickle at the best of times, and this year they have proven to be especially unreliable (understandably so under the circumstances). In practice much will depend on how the pandemic and its impacts play out from here. Risks certainly remain and this isn’t time for complacency or loose, poorly targeted spending.
Fewer lambs but high lambing percentage
Sheep and beef farmers this spring achieved a near record lambing percentage, according to Beef + Lamb New Zealand’s Lamb Crop Outlook report for 2020.
The 130.3% lambing percentage recorded for spring 2020 was only slightly lower than spring 2019 where 131.0% was achieved. It was similar in both islands (130.6% for the North Island and $130.0% for the South Island). Such a high lambing percentage is a great achievement given the disruptions of drought and pandemic.
The number of lambs tailed in spring 2020 decreased by 1.5% (357,000) on the previous spring to 22.89 million. The decline was due to the North Island, where drought conditions resulted in the number of lambs tailed falling 4.8% (546,000) to 10.80 million. In contrast, the South Island saw an increase of 1.6% (189,000 to 12.08 million.
The smaller lamb crop will have implications for exports, with the number of lambs processed for export in 2020/21 season expected to decrease 4.5% from 19.1 million to 18.25 million. Combined with a slightly lower average carcass weight, the amount of lamb to be produced for export is expected to fall by 4.7%.
The number of adult sheep processed for export is also expected to decrease 10.8% from 3.5 million to 3.15 million. This is due to a 16.3% decline in the North Island as sheep farmers recover the large number of breeding ewes sold in 2020 due to the drought.
B+LNZ is also forecasting lamb prices to be similar or slightly above five-year averages.
Dairy prices rise
The Global Dairy Trade ended the year on a positive note, with the GDT Price Index rising 1.3% at this week’s auction – the final one for 2020.
All commodities traded increased in price. Whole milk powder was up 0.5%, skim milk powder up 1.2%, anhydrous milk fat up 1.9%, butter up 6.0%, cheddar up 4.2%, and lactose up 1.5%. Overall, 31,701 tonnes of product were sold and the average selling price was US$3,317.
The GDT Price Index has increased at six of the last seven auctions, and it is 1.3% higher than at the same time last year.
The next GDT auction will be held on 5 January 2021.
Food prices down
Food prices fell 0.9% in November 2020, according to Statistics NZ’s monthly Food Price Index. After seasonal adjustment food prices were fairly stable (down 0.1%) and in annual terms they were up 2.6%, fairly similar to October’s annual increase of 2.7%.
In November 2020 compared to October 2020:
- Fruit and vegetable prices fell 3.7%, with fruit up 5.2% but vegetables down 9.9%.
- Meat, poultry, and fish prices fell 1.6%, with beef & veal down 1.8% but mutton, lamb and hogget up 1.0%.
- Grocery food prices fell 0.4%, with bread & cereals unchanged and milk, cheese & eggs down 0.7%.
On an annual basis, comparing November 2020 to November 2019:
- Fruit and vegetable prices rose 9.6%, with fruit up 10.0% and vegetables up 9.3%.
- Meat, poultry, and fish prices fell 0.7%, with beef & veal up 4.1% but mutton, lamb and hogget down 0.1%.
- Grocery food prices rose 0.5%, with bread & cereals up 0.2% and milk, cheese & eggs up 1.6%.
Farm market strengthening
Real Estate Institute’s latest monthly Rural Property Data show farm sales continuing their recovery since the start of spring.
For the three months ended November 2020 there were 441 farm sales, up 56.4% on the same period last year. Sales were also up on an annual basis, with 1,412 farms sold in the year to November 2020, up 9.0% on the previous year to November 2019. Dairy farm sales were up 12.9% and finishing farms were up 16.2%, but grazing farms were down 6.4% and arable farms were down 25.3%.
Sales prices were a mixed bag. The median price per hectare for all farms sold for the three months to November 2020 was $27,763, up 10.2% on the same period last year, but down 2.2% compared to the three months ended October 2020. The REINZ All Farms Price Index, which adjusts for differences in farm size, location, and farming type, was also down 1.3% compared to the three months ended November 2019.
Housing market still running hot.
The number of houses sold in November surged to the highest monthly tally in nearly 14 years and house prices hit new record highs, according to the Real Estate Institute’s latest monthly Residential Property Data.
The number of residential properties sold in November 2020 increased by 29.6% from the same time last year (from 7,627 to 9,885) – the highest number of properties sold since March 2007 and the highest November sales since November 2006. Auckland was particularly strong, with volumes up 53.9% on November 2019, but there was also very strong volume growth in the West Coast, Northland, Canterbury, Bay of Plenty, Nelson, and Waikato regions.
Median house prices increased by 18.5% from $632,000 in November 2019 to a new record median high of $749,000 in November 2020; and up from $725,000 in October – a $24,000 increase in just one month. Auckland’s median price was up 16.4% to $1,030,000 but it was the regions which saw the biggest annual increases, with Gisborne up 36.2%, while Tasman, Manawatu-Wanganui, Southland, and Taranaki all posting rises of more than 20%.
Median days to sell a house in November 2020 was 29 days, down 4 days compared to November 2019.
The buoyant housing market is both a product of and a driver of the economic recovery. However, it is proving to be a political headache for the Government, especially one concerned about housing unaffordability and impacts on poverty and inequality. It is working on housing policies with announcements expected in the New Year.
Consumers confident
As Christmas approaches, consumers have become more festive, according to the Westpac McDermott Miller Consumer Confidence Index.
The Index rose 10.9 points from the September quarter to the December quarter, taking it to a level of 106.0. A score over 100 indicates there are more optimists than pessimists, while a score below 100 indicates more pessimists than optimists.
The strong quarterly rise in confidence reverses the slump that followed the outbreak of Covid-19 and related lockdown of the economy earlier in 2020. It is now only 3.9 points below that in December 2019.
Manufacturing expanding but services contracting.
New Zealand’s manufacturing sector experienced a pick-up in expansion during November, according to the latest BNZ-BusinessNZ Performance of Manufacturing Index (PMI).
The seasonally adjusted PMI for November was 55.3 (above 50.0 indicates manufacturing is generally expanding; below 50.0 that it is declining). This was up 2.9 points from October, and the highest level of expansion since July.
However, it was a very different story for services with the BNZ-BusinessNZ Performance of Services Index (PSI) showing activity in the services sector falling back into contraction.
The PSI for November was 46.7, down 4.1 points from October. This was the lowest level of activity since May 2020 and signals a disappointing loss in momentum after the post-lockdown bounce.
Departures exceeding arrivals.
Statistics NZ’s International Migration and Travel Statistics have shown more people leaving the country than arriving since border restrictions were imposed.
From April 2020 (the first full month under border restrictions) to October 2020, there were 119,400 departures, and 65,900 arrivals. In the same period in 2019 there were 3.86 million departures and 3.82 million arrivals.
Of the 65,900 arrivals, 23,200 were New Zealand residents, returning from a trip overseas of less than 12 months. The remaining 42,700 arrivals were overseas residents. These are people who have been living overseas for more than 12 months before their arrival, with two- thirds of them being New Zealand citizens. A lot of the 119,400 departures will have been overseas people accessing commercial or repatriation flights.
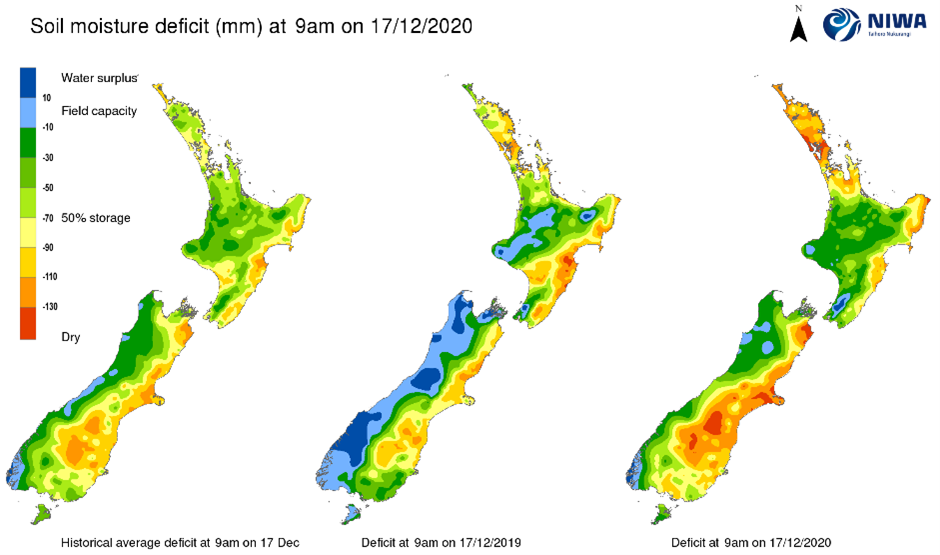
NIWA Soil Moisture Data
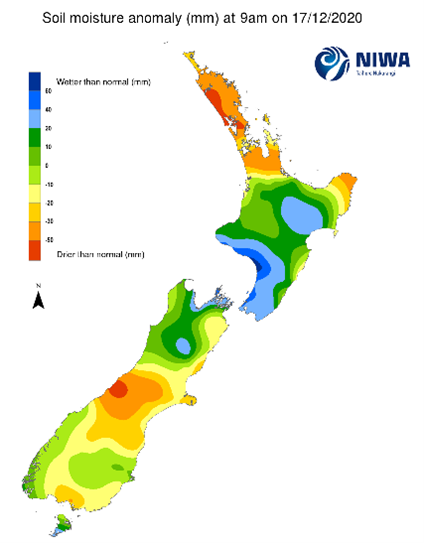
NIWA’s latest soil moisture maps (as at 9am Thursday 17 December) show a mixed picture. Soils are significantly dryer than usual in the Northland, Auckland, Hauraki-Coromandel, and East Cape areas of the North Island, while in the South Island, they are significantly dryer in South Westland spilling over to inland areas of Mid Canterbury and South Canterbury, and a small patch around Invercargill.
Meanwhile, soils are significantly wetter than usual in areas of the North Island from Rotorua through to Wairoa and from South Taranaki through to Wairarapa, while in the South Island they are significantly wetter from Tasman Bay to the Marlborough Sounds, a patch around Lewis Pass, and bottom of Stewart Island.
Exchange Rates
The NZ Dollar was up this week, strengthening 0.7% against the TWI. It was up against all our major trading partners, except the Australian Dollar.
|
NZ Dollar versus
|
This Week
(17/12/20)
|
Last Week (10/12/20)
|
Last Month (17/11/20)
|
Last Year (17/12/19)
|
|
US Dollar
|
0.7111
|
0.7020
|
0.6911
|
0.6599
|
|
Australian Dollar
|
0.9381
|
0.9429
|
0.9434
|
0.9603
|
|
Euro
|
0.5831
|
0.5810
|
0.5825
|
0.5925
|
|
UK Pound
|
0.5264
|
0.5246
|
0.5228
|
0.4969
|
|
Japanese Yen
|
73.53
|
73.19
|
72.21
|
72.28
|
|
Chinese Renminbi
|
4.6481
|
4.5893
|
4.5451
|
4.6213
|
|
Trade Weighted Index
|
74.30
|
73.75
|
73.27
|
72.77
|
Source: Reserve Bank of NZ
Wholesale Interest Rates
Over the course of the week the yield for the 90 Day Bank Bill was unchanged but the yield for 10 year Government Bonds was down 1 basis point. The Reserve Bank will next review monetary policy settings (including the OCR) on 24 February 2021.
|
|
This Week
(17/12/20)
|
Last Week (10/12/20)
|
Last Month (17/11/20)
|
Last Year (17/12/19)
|
|
OCR
|
0.25%
|
0.25%
|
0.25%
|
1.00%
|
|
90 Day Bank Bill
|
0.26%
|
0.26%
|
0.25%
|
1.22%
|
|
10 Year Government Bond
|
0.92%
|
0.93%
|
0.88%
|
1.56%
|
Source: Reserve Bank of NZ