Economic Week - July 3
by Nick Clark
Ag debt stable
Lending to the agricultural sector was stable in May according to the Reserve Bank’s monthly Sector Lending Statistics.
Agricultural lending was $62.83 billion in May 2020, up $26 million (or 0.04%) compared to April. However, compared to May 2019, the sector’s debt is down $631 million, or 1.0%.
Turning to the agricultural sub-sectors, lending to:
- Dairy cattle farming was $39.86 billion, up $26 million for the month but down $1.67 billion (or 4.0%) for the year.
- Sheep, beef cattle, and grains farming was $15.00 billion, down $27 million for the month but up $490 million (or 3.4%) for the year.
- Horticulture was $5.24 billion, up $17 million for the month and up $484 million (or 10.2%) for the year.
- Other farming $2.36 billion, up $10 million for the month and up $49 million (or 2.1%) for the year.
Looking at other sectors, housing lending was up 6.3% for the year, business lending up 5.0%, but personal consumer lending down 10.9%.
Farm Debt Mediation Scheme open for business
Speaking of agricultural lending, the Government’s Farm Debt Mediation Scheme started this week on 1 July.
The Scheme requires creditors to offer mediation to farmers who default on payments before they take any enforcement action and allows farmers to ask for mediation at any time.
Two approved mediation organisations, the Arbitrators and Mediators Institute of New Zealand and Resolution Institute have been appointed to deliver the scheme.
Anyone wishing to access the scheme should visit the MPI website.
Interest rates dampen on-farm inflation
Sheep and beef farm input prices rose by just 0.4% for the year to March 2020, according to Beef + Lamb New Zealand Economic Service’s annual Sheep and Beef On-Farm Inflation Report.
Large falls in interest rates were the main factor suppressing on-farm inflation. Of the 16 input categories, prices increased for 12 and decreased for four – fertiliser, lime, and seeds (down 0.3%); fuel (down 0.4%); electricity (down 0.1%); and interest (down 7.2%).
The most significant price increases were for insurance (up 5.0%); repairs, maintenance, and vehicles (up 4.2%); rates (up 3.7%); and animal health (up 3.7%).
When excluding interest, annual on-farm inflation was still a relatively modest 1.5%.
Business confidence improves
Business confidence lifted in June but remains deeply negative and consistent with the start of a recession, according to ANZ’s June Business Outlook Survey.
Overall, a net 34.4% of respondents expect general economic conditions to worsen over the next 12 months, a 7.4 point improvement on May’s survey and about the same as June’s preliminary results. There was a 12.8 point improvement for ‘own activity’, with a net 25.9% expecting their activity to decrease. Own activity tends to be a better predictor for GDP growth.
Agriculture remains by far the most pessimistic sector on the economy, with a net 63.3% expecting general economic conditions to worsen, but this was 18.8 points better than May’s dismal score of -82.1%. There was also big improvement in agricultural respondents’ own activity expectations, up 22.6 points to a net 16.7% expecting their activity to reduce.
In contrast to its views about the general economy, agricultural respondents’ confidence about their own activity is more positive than most sectors. The retail sector own activity indicator bounced nearly 30 points, reflecting the end of lock-down. Construction sentiment worsened though.
As does farmer confidence
Following a sharp drop in March, agricultural sector confidence has rebounded according to Rabobank’s June quarter Rural Confidence Survey. Concern about the impacts of COVID-19 receded, but it continues to be a key source of anxiety among farmers and overall confidence remains deep in negative territory.
In this survey net farmer confidence rose to -26%, up from -44% recorded in the March quarter. There was an increase in those expecting agricultural economic conditions to improve in the coming 12 months (up from 12% to 16%), while fewer farmers were expecting the agricultural economy to worsen (down from 56% to 42%). The number of farmers expecting conditions to remain the same stood at 39%, up from 29%.
COVID-19 was cited as a key concern by 38% of farmers with a pessimistic outlook for the agricultural economy, well back on the 84% recorded in the March survey when the pandemic was taking hold across the globe.
Federated Farmers’ own six-monthly Farm Confidence Survey is currently in the field and we expect the results later in July.
House consents bounce
Thanks to the end of lock-down, the number of new dwellings consented in May 2020 increased 64% from April, according to Statistics NZ’s monthly Building Consents Issued. This was the largest monthly change since February 1972.
For the year ended May 2020, the actual number of new dwellings consented was 37,010, up 2,301 or 6.6% from the May 2019 year. The value of these consents was $13.6 billion, up $599 million or 4.9%.
Meanwhile, non-residential building consents totalled $6.5 billion for the year ended May 2020, down $965 million or 12.5% from the May 2019 year. $271 million of farm buildings were consented, down $50 million or 15.6% on the May 2019 year.
Activity down in April and May
A new economic indicator was launched this week to provide more granular and timely signalling of New Zealand economic activity.
The New Zealand Activity (NZAC) Index, constructed by officials from Treasury, Statistics NZ, and the Reserve Bank, shows activity in April 2020 down 19% on April 2019. And although activity bounced back in May, May 2020 was still down 6.5% on May 2019.
The NZAC Index is not an official statistic. Rather it summarises eight monthly indicators of economic activity covering consumer spending, unemployment, job vacancies, traffic volumes, electricity generation, economic outlook, and manufacturing expectations. It will be updated around 14 days after the end of each month.
Another fascinating ‘real-time’ economic indicator is Massey University’s GDP Live Dashboard. The Dashboard is currently picking a 15.9% drop in GDP for the June 2020 quarter. As well as national GDP, it also predicts GDP changes for regions and most industries (although not yet the primary industries).
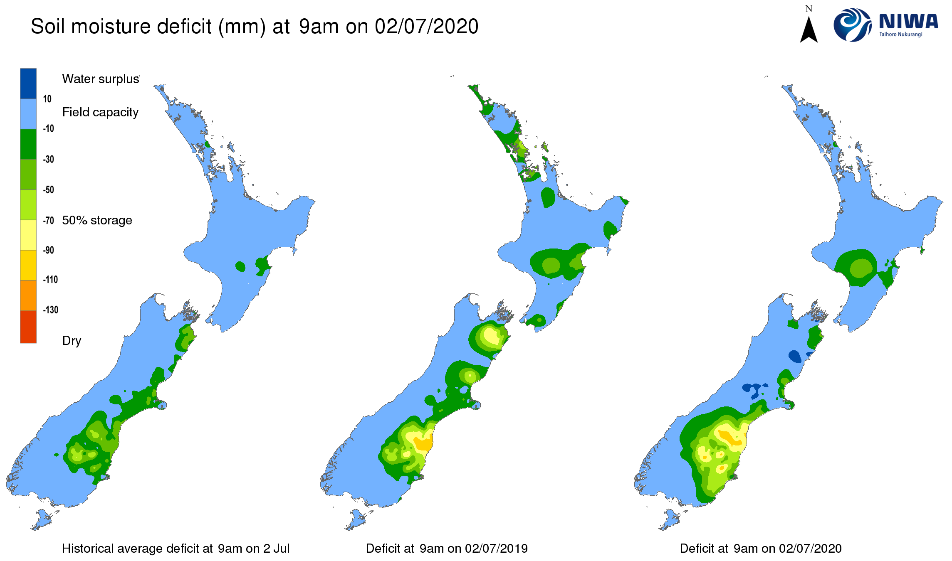
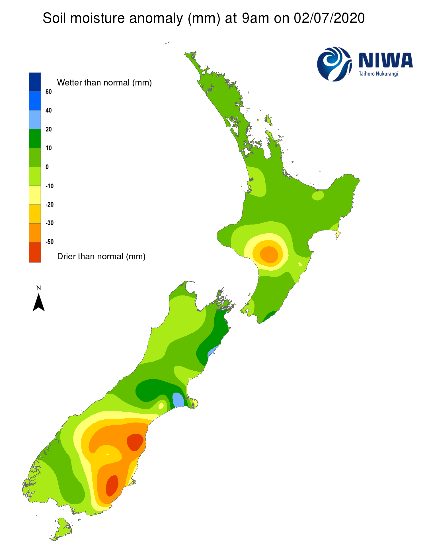
NIWA Soil Moisture Data
NIWA’s latest soil moisture maps (as at 9am Thursday 2 July) show that after plenty of recent rain most of the country’s soils are about average for soil moisture for this time of year. The exceptions are Rangitikei, Canterbury, and Otago which were dryer than usual and Kaikoura and Selwyn which were wetter than usual.
Exchange Rates
The NZ Dollar strengthened this week against the TWI and against all our major trading partners.
|
NZ Dollar versus
|
This Week
(2/7/20)
|
Last Week (25/6/20)
|
Last Month (2/6/20)
|
Last Year (2/7/19)
|
|
US Dollar
|
0.6483
|
0.6415
|
0.6280
|
0.6675
|
|
Australian Dollar
|
0.9385
|
0.9344
|
0.9254
|
0.9570
|
|
Euro
|
0.5761
|
0.5702
|
0.5645
|
0.5916
|
|
UK Pound
|
0.5196
|
0.5165
|
0.5023
|
0.5280
|
|
Japanese Yen
|
69.68
|
68.70
|
67.61
|
72.39
|
|
Chinese Renminbi
|
4.5817
|
4.5379
|
4.4721
|
4.5769
|
|
Trade Weighted Index
|
71.95
|
71.28
|
70.30
|
73.10
|
Source: Reserve Bank of NZ
Wholesale Interest Rates
Over the course of the week the 90 Day Bank Bill interest rate was up 1 basis point and the rate for 10 Year Government Bonds was up 6 basis points. The OCR will next be reviewed on 12 August.
|
|
This Week
(2/7/20)
|
Last Week (25/6/20)
|
Last Month (2/6/20)
|
Last Year (2/7/19)
|
|
OCR
|
0.25%
|
0.25%
|
0.25%
|
1.50%
|
|
90 Day Bank Bill
|
0.31%
|
0.30%
|
0.26%
|
1.62%
|
|
10 Year Government Bond
|
1.00%
|
0.94%
|
0.83%
|
1.57%
|
Source: Reserve Bank of NZ