Economic Update - July 20
by Nick Clark
Inflation rises
Inflation edged back up in the June quarter, according to Statistics NZ’s quarterly Consumer Price Index.
In the June 2018 quarter the CPI rose 0.4%, mainly due to a 0.9% increase for housing and household utilities, which in turn was influenced by increases for rents (up 0.8%), construction of new dwellings (up 1.1%), and electricity (up 1.7%).
Compared to June 2017, the annual rate of inflation increased to 1.5%. This is slightly more than expectations but remains well below the Reserve Bank’s 2% target mid-point.
Again, housing and household utilities was a main driver of annual inflation, rising 3.1% for the year – twice the overall rate.
GDT down - again
Dairy product prices fell 1.7% at this week’s Global Dairy Trade auction.
Although whole milk powder rose 1.5% and skim milk powder rose 0.8%, these gains were more than outweighed by big drops for rennet casein (down 9.5%), butter (down 8.1%), anhydrous milk fat (down 5.2%) and cheddar (down 3.3%).
The average selling price was US$3,222 a tonne, with 25,454 tonnes of product was sold.
This was the fourth consecutive fall for the GDT and there have been drops in nine of the 11 events since February. The GDT Price Index is now down 10.5% on the same time last year.
Farm sales down
Farm sales volumes and prices both fell in June, according to the Real Estate Institute’s Rural Market Statistics.
There were 427 farm sales in the three months to June 2018, down 7.0% on the same three-month period last year. For the full year to June 2018, there were 1,480 farm sales, down 17.0% on the previous year. There were particularly large annual drops in the sales of grazing farms (down 28.0%), arable farms (down 25.0%) with smaller drops for sales of dairy farms (down 1.2%) and finishing farms (down 3.2%).
The median price per hectare for all farms sold in the three months to June 2018 was $21,745 down 16.3% on the same three-month period last year. However, the REINZ All Farm Price Index, which adjusts for farm size, location and farming type was up 3.7% compared to June 2017.
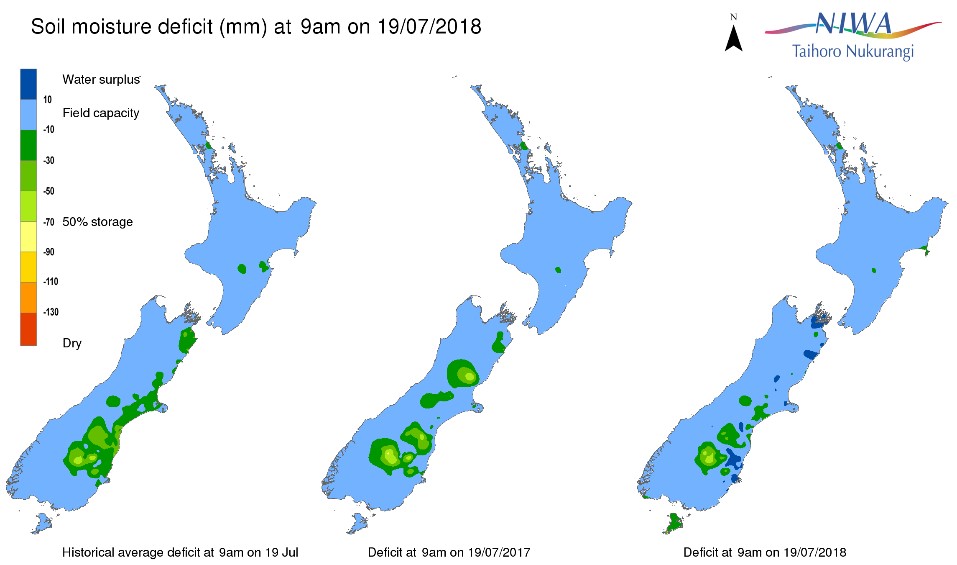
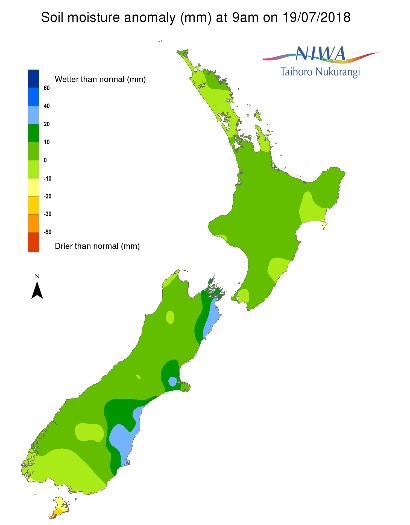
NIWA Soil Moisture Data
NIWA’s latest soil moisture maps (as at 9am Thursday 19 July) continue to show most of the entire country, except Stewart Island, either around average or wetter than usual at this time of year.
Exchange Rates
|
NZ Dollar versus
|
This Week
(19/7/18)
|
Last Week (12/7/18)
|
Last Month (19/6/18)
|
Last Year (19/7/17)
|
|
US Dollar
|
0.6799
|
0.6753
|
0.6934
|
0.7345
|
|
Australian Dollar
|
0.9145
|
0.9160
|
0.9346
|
0.9266
|
|
Euro
|
0.5836
|
0.5783
|
0.5970
|
0.6364
|
|
UK Pound
|
0.5200
|
0.5117
|
0.5252
|
0.5637
|
|
Japanese Yen
|
76.64
|
75.81
|
76.13
|
82.31
|
|
Chinese Renmimbi
|
4.5764
|
4.5222
|
4.4754
|
4.9610
|
|
Trade Weighted Index
|
0.7319
|
72.67
|
73.64
|
77.93
|
Source: Reserve Bank of NZ
Wholesale Interest Rates
|
|
This Week
(19/7/18)
|
Last Week (12/7/18)
|
Last Month (19/6/18)
|
Last Year (19/7/17)
|
|
OCR
|
1.75%
|
1.75%
|
1.75%
|
1.75%
|
|
90 Day Bank Bill
|
1.92%
|
1.95%
|
2.02%
|
1.94%
|
|
10 Year Government Bond
|
2.86%
|
2.86%
|
2.89%
|
2.93%
|
Source: Reserve Bank of NZ