Economic Update
December 22, 2017
by Nick Clark
With the year drawing rapidly to a close it was a huge week of economic data. Santa dished out plenty of statistical goodies but they were a decidedly mixed bag.
GDP
Economic activity increased by 0.6% in the September 2017 quarter, according to Statistics NZ’s
Gross Domestic Product statistics. This was close to market expectations.
What was more surprising were upward revisions to previous quarters which portray a much stronger economy than previously understood. For the year ended March 2016 GDP growth was revised up from 2.4% to 3.6% and for the year ended March 2017 it was revised up from 2.9% to 3.7%.
Turning back to the September 2017 quarter, the sectors with the strongest growth were construction (up 3.6%) and mining (up 3.2%). In contrast, agriculture, forestry and fishing was down 1.0% due mainly to wet weather weighing on milk production.
Compared to the September 2016 quarter, annual GDP was up 2.7%. This indicates a bit of a slow-down but still respectable. All sectors grew, including agriculture, forestry and fishing which was up 3.4%.
Taking account of population growth, GDP per capita was up 0.2% for the quarter and 0.6% for the year.
Business Confidence
After confidence crashed in November, businesses – but not farmers – showed a little more Christmas cheer in ANZ’s December
Business Outlook Survey.
Overall, a net 37.8% of businesses expected economic conditions to worsen over the next 12 months, an improvement of 1.5 points on November. Meanwhile, a net 15.6% expected their own business activity to increase, up 9 points. A welcome bounce but still pretty anaemic.
Agriculture was by a long way the most pessimistic sector and its confidence bucked the overall results by falling even further. A net 68.5% expected economic conditions to worsen, down a further 13 points on November’s already very pessimistic result. Meanwhile a net 5.2% expected their own business activity to increase, a slump of 16 points.
As well as ongoing concern about the new government’s policies, dry weather and a weaker forecast milk price will have been key factors behind the further drop in farmer confidence.
GDT Auction
After edging up in the last auction a fortnight ago, the
Global Dairy Trade resumed its run of losses, dropping 3.9% in this week’s auction. All commodities fell in price, with whole milk powder down 2.5% and skim milk powder down 4.8%. The average selling price was US$2,969 and 29,592 tonnes were sold.
Compared to this time last year the GDT is down 13.1%. The last three months have seen a steady decline, with five falls out of six since the start of October.
Farm Sales
The rural real estate market remains constrained by difficult conditions according to the Real Estate Institute’s
Rural Market Statistics. There were 316 farm sales in the three months ended November 2017, down 29.3% on the same period last year. Overall, there were 1,577 farms sold for the year ended November 2017, down 12.5% on the previous year.
The median sales price per hectare for the three months ended November 2017 was $26,802, up 1.7% on the same period last year. Meanwhile, the REINZ All Farm Price Index was up 13.9% compared to November 2016. The Index adjusts for differences in farm size, location and farming type.
REINZ cited climatic and financial factors for keeping the rural sector under pressure and it noted that a record number of farms have come to the market. This has yet to be reflected in sales prices.
Balance of Payments
New Zealand recorded a current account deficit of $1.3 billion in the September quarter, according to Statistics NZ’s quarterly
Balance of Payments and International Investment Position. This $183 million lower than the June quarter deficit. Compared to June there was a drop in the goods trade deficit, partly offset by a drop in the services trade surplus and an increase in the investment income deficit.
For the year ended September 2017, the current account deficit was $7.1 billion, unchanged compared to the year ended September 2016. This equated to 2.6% of GDP, down slightly on the previous year’s 2.7%. This is below its historical average of 3.6%.
Meanwhile, New Zealand’s net international liability position decreased to its lowest recorded level as a percentage of GDP since records began in 2000. The net liability position was $156.7 billion (56.3% of GDP) down from $157.2 billion (57.4%) in the June quarter.
Exports and Imports
Imports surprised on the upside and resulted in a larger than expected monthly goods trade deficit of $1.2 billion. Statistics NZ’s monthly
Merchandise Trade Statistics for November 2017 showed goods exports of $4.6 billion, up 19.6% on November 2016. However, goods imports grew even more rapidly, up 26.7% to a new record month high of $5.8 billion.
Looking at agricultural exports, milk powder, butter and cheese was up 21.7% to $1.5 billion, meat was up 47.2% to $499 million, and wool was up 21.7% to $65 million.
For the year ended November 2017, goods exports were $52.5 billion (up 8.4% on year ended November 2016) and goods imports were $56.0 billion (also up 8.4%), leaving a goods trade deficit of $3.4 billion.
Exports of milk powder, butter and cheese were $13.6 billion (up 22.5% for the year), meat exports were $6.4 billion (up 6.4%), and wool exports were $513 million (down 23.3%).
Migration and Tourism
There was a net gain of 70,400 migrants in the year ended November 2017, with 131,500 migrant arrivals and 61,200 migrant departures, according to Statistics NZ’s monthly
International Travel and Migration Statistics.
Although net migration remains strong, it does appear to be slowing. Annual net migration in November 2017 was at the same level as the November 2016 year and has been reducing since the peak of 72,400 in the July 2017 year.
Meanwhile, in the month of November 2017, there were 360,100 visitor arrivals. This is 33% more than in October 2017, signalling the start of the peak visitor season. A record 3.7 million visitors arrived in the November 2017 year, an 8% increase from the November 2016 year.
The visitor arrival figures follow the release last week of Statistics NZ’s
Tourism Satellite Account 2017. It showed total tourism spending of $36.0 billion in the year to March 2017, up 1.9% on the year to March 2016. Spending by international visitors dropped slightly (down 0.9%) but growth in spending by domestic tourists more than offset this (up 4.0%).
Spending by international tourists ($14.5 billion) continued to be higher than dairy export revenue ($12.4 billion) but dairy and meat combined was higher ($18.4 billion).
Total GST revenue of all tourists (international and domestic) was $3.3 billion, of which $1.5 billion was from international tourists. Central government does very well out of tourism spending. Surely it is time for some of this is returned to areas where tourism is placing pressure on local infrastructure.
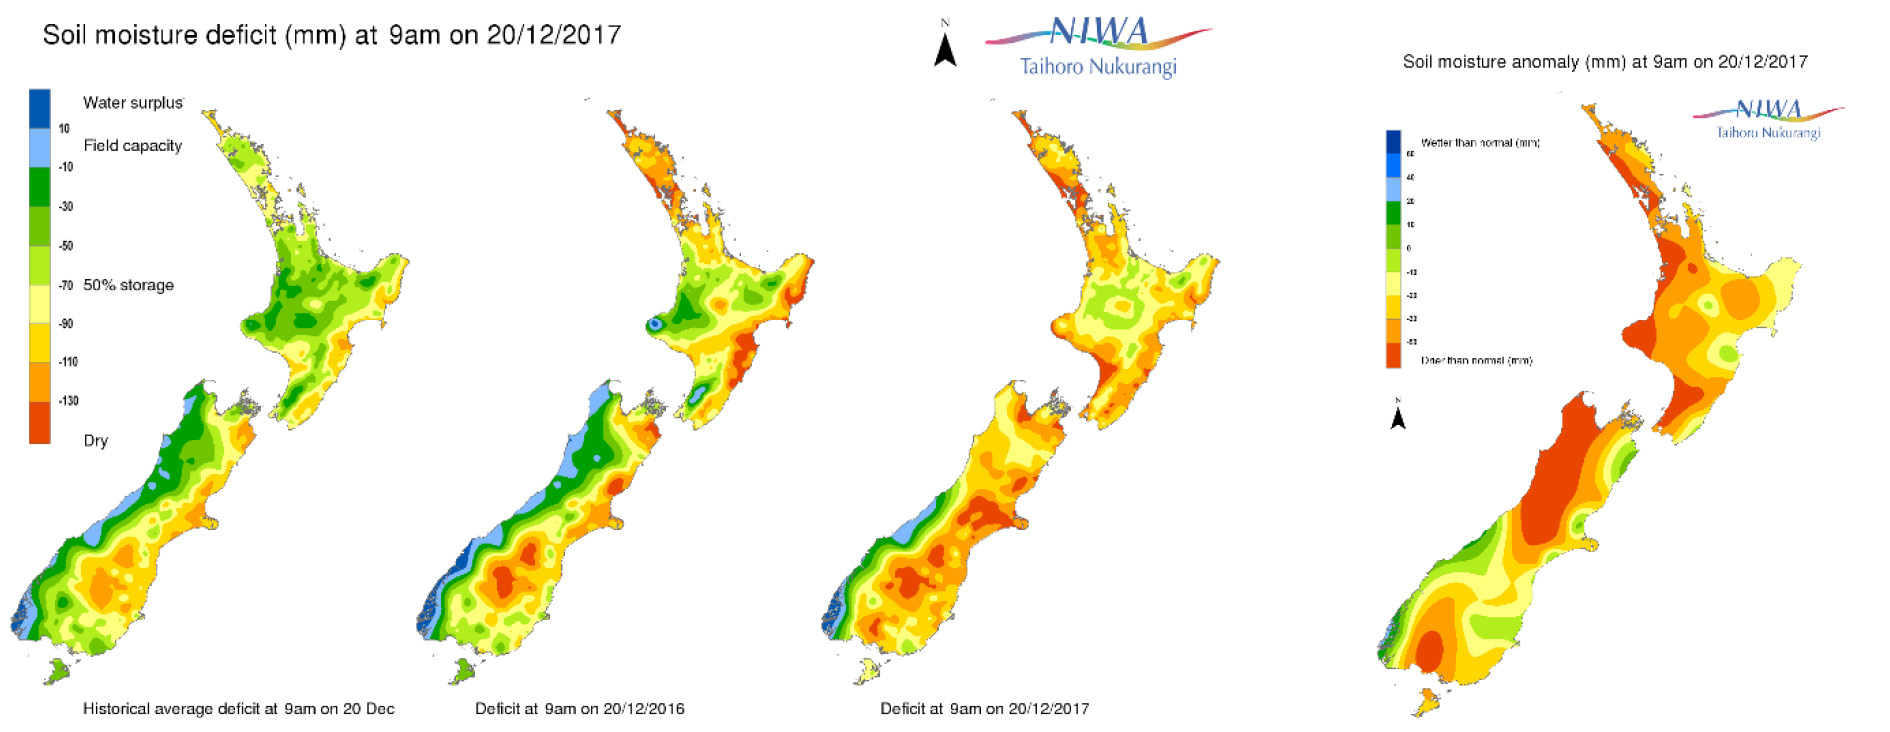
Moisture Watch
The latest NIWA soil moisture data as at 20 December shows that despite some rain this week much of the country remains not only dry but drier than usual.
Exchange Rates
| NZ Dollar |
This Week
(21/12/17) |
Last Week
(14/12/17) |
Last Month
(21/11/17) |
Last Year
(21/12/16) |
| US Dollar |
0.7001
|
0.7013
|
0.6816
|
0.6923
|
| Australian Dollar |
0.9135
|
0.9146 |
0.9030 |
0.9530 |
| Euro |
0.5896
|
0.5924 |
0.5805 |
0.6664
|
| UK Pound |
0.5237 |
0.5226 |
0.5146 |
0.5603 |
| Japanese Yen |
79.30 |
79.08 |
76.74 |
81.67 |
| Chinese Renmimbi |
4.6067
|
4.6428
|
4.5191
|
4.8121 |
| Trade Weighted Index |
73.86 |
74.07 |
72.46 |
77.37 |
Source: Reserve Bank of NZ
Wholesale Interest Rates
| |
This Week
(21/12/17) |
Last Week
(14/1217) |
Last Month
(21/11/17) |
Last Year
(21/1216) |
| OCR |
1.75% |
1.75% |
1.75% |
1.75% |
| 90 Day Bank Bill |
1.88% |
1.86% |
1.92% |
2.02% |
| 10 Year Government Bond |
2.76% |
2.78% |
2.83% |
3.42% |
Source: Reserve Bank of NZ