Economic Update - October 12
by Nick Clark
Fonterra cuts forecast milk price
Fonterra this week cut its 2018/19
forecast milk price to a range of $6.25 to $6.50 per kg milk solids, down from its previous forecast of $6.75. Fonterra’s decision reflects the impact of strong global milk production and also a forecast increase in its New Zealand milk production (up 1.3% to 1,550 million kgMS) after a strong first few months of the season.
The reduced milk price forecast will be disappointing to farmer suppliers but it should not come as any great surprise given the extended run of falls in the GDT auction which saw economists downgrading their forecasts.
For a typical dairy farm of 414 cows producing 160,200 kgMS, the reduced forecast would cut its income by between $40,000 (at a $6.50 milk price) and $80,000 (at a $6.25 milk price). For Fonterra suppliers as a whole that equates to between $387 million and $774 million, money which might have to be cut from farm budgets and not be able to be spent in rural and provincial economies.
Government’s books flush
The Government ran a big surplus last financial year, according to the Crown’s
Financial Statements for the year-ended 30 June 2018. The headline $5.5 billion operating balance before gains and losses was a whopping $2.4 billion above the Treasury’s Budget 2018 forecast.
A number of factors contributed to the result being so far ahead of expectations. On the spending side, a number of ‘one-offs’ led to core Crown expenses coming in 1.4% below forecast. The Treasury reckons this was largely due to timing issues, with much of the variance to reverse out in the 2018/19 accounts. Core Crown expenses were stable at 27.9% of GDP.
On the revenue side, core Crown tax revenue was 0.9% higher than expected. Corporate tax revenue was up, due to profits for both large and small businesses being higher than forecast. A strong increase number of people in employment (up 3.7% for the year) and higher average wages (up 3.0%) also boosted personal income tax. Fiscal drag, where wage increases push people move into higher tax brackets, will also be playing a part.
At 30 June 2018, net core Crown debt was 19.9% of GDP, compared to the 20.8% forecast in Budget 2018 and below the Government’s 20% debt target.
Predictably the big surplus prompted a clamour of voices wanting a spend-up and to relax the debt target. However, while the result is good it is in the past. Many (but not all) of the Government’s new spending initiatives announced last December or in its May Budget took effect from the start of the current financial year. And with the economy slowing and costs rising, this year is likely to be tighter. The Minister of Finance was right to dampen expectations.
Food prices flat
Food prices fell by 0.1% in the month of September according to Statistics NZ’s monthly
Food Price Index.
The biggest monthly mover was fruit and vegetable prices, which were down 5.4% (vegetables down 8.7% but fruit up 0.3%). Meat, poultry and fish prices were up 1.7% (beef and veal up 4.6% and mutton, lamb and hogget up 2.8%), while grocery foods prices were up 0.9% (bread and cereals down 0.3% and milk, cheese and eggs up 2.0%).
On an annual basis, food prices were up just 0.1%, well below the overall level of inflation of around 1.5%. Fruit and vegetable prices were again the main downward driver, falling 7.1% for the year (vegetables down 8.9% and fruit down 3.6%). Meat, poultry and fish prices were up 0.9% (beef and veal up 4.4% and mutton, lamb and hogget up 3.4%), while grocery foods prices were up 0.2% (bread and cereals down 2.0% and milk, cheese and eggs up 2.2%).
Fuel drives card spending up
Quarterly retail card spending in the September 2018 quarter rose at its fastest pace in seven and a half years, according to Statistics NZ’s
Electronic Card Transactions.
When adjusted for seasonal effects, retail card spending was up 2.3% in the September 2018 quarter, bouncing back from a 0.3% drop in the June quarter.
The lift was widespread across retail sectors but fuel was a particularly strong contributor, up a seasonally-adjusted 3.4% thanks to record high prices at the pump. Grocery and liquor retailing was up 2.4%.
On an annual basis card spending was up 4.9% compared to September 2017, with fuel spending again the strongest contributor, up 12.0%.
House prices up
House sales were low but median prices rose in September according to the Real Estate Institute’s
Residential Market Statistics. 5,506 houses were sold in September 2018, down 3.0% compared to September 2017. This was put down to a very low number of listings in July 2018.
The median sales price as $556,000, up 5.9% on September 2017. Auckland’s median price was unchanged on $850,000, but outside Auckland median price was up 8.5% to $467,000. Gisborne had the biggest increase (up 26.9%), followed by Nelson (up 23.1%), while the West Coast had the biggest decrease (down 4.1%).
NIWA Soil Moisture Data
NIWA’s latest
soil moisture maps (as at 9am Thursday 11 October) show the country continuing to dry out, with dryer-than-usual conditions prevailing across most of the North island and the top half of the South Island. The Hurunui area is getting particularly dry. Coastal Otago remains wetter than usual though.

Exchange Rates
The NZ Dollar was down slightly against the Trade Weighted Index. It was down against most of our main trading partners’ currencies, with the exception of the Chinese Renmimbi where it was up slightly.

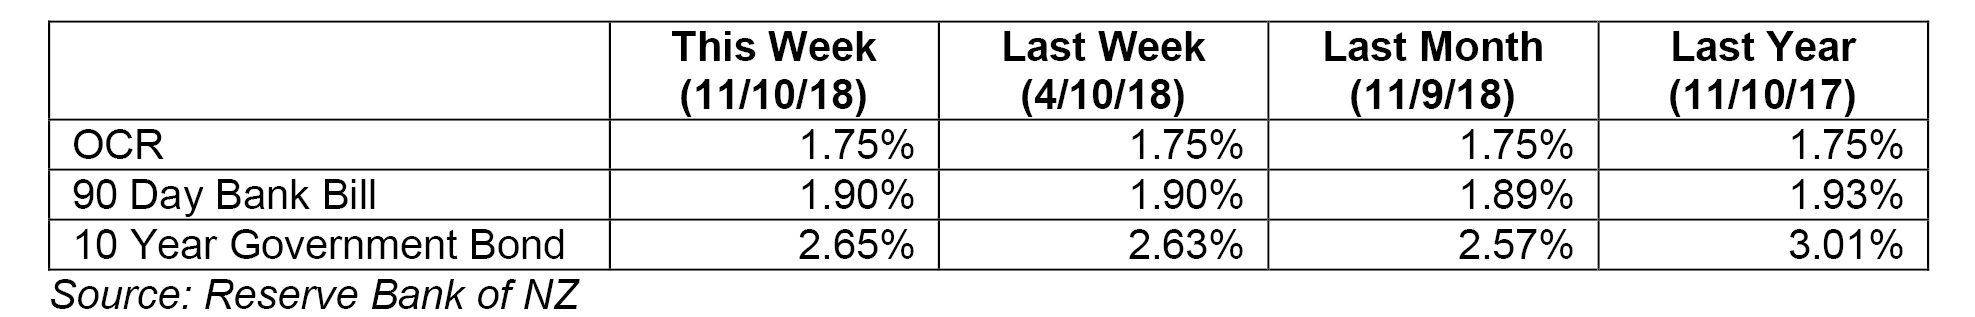
Wholesale Interest Rates
Wholesale interest rates (90-day and 10-year) were stable over the week. The OCR has been unchanged on 1.75% since November 2016.